Create a task dashboard to track the execution of outcomes, projects, and meetings.
Task dashboards are a performance measurement tool used to track and evaluate the delivery of tasks in a simple or project task board.
Task dashboards tell the viewer if tasks are getting done or not.
A task dashboard can be viewed within the specific task board in the task module. This will show the status of tasks only for the task board.
Within the Dashboard module, task dashboards can be run to look at tasks more holistically.
This is done using the filter set. A task dashboard can be used to filter tasks by the following.
- Task board; by selecting a known board.
- Team; by selecting a team set in the Admin centre.
- Task owner; by selecting a specific task owner/user.
- Tag; by selecting a specific tag set by a task owner on a task.
- Date range; by selecting a date range to filter tasks.
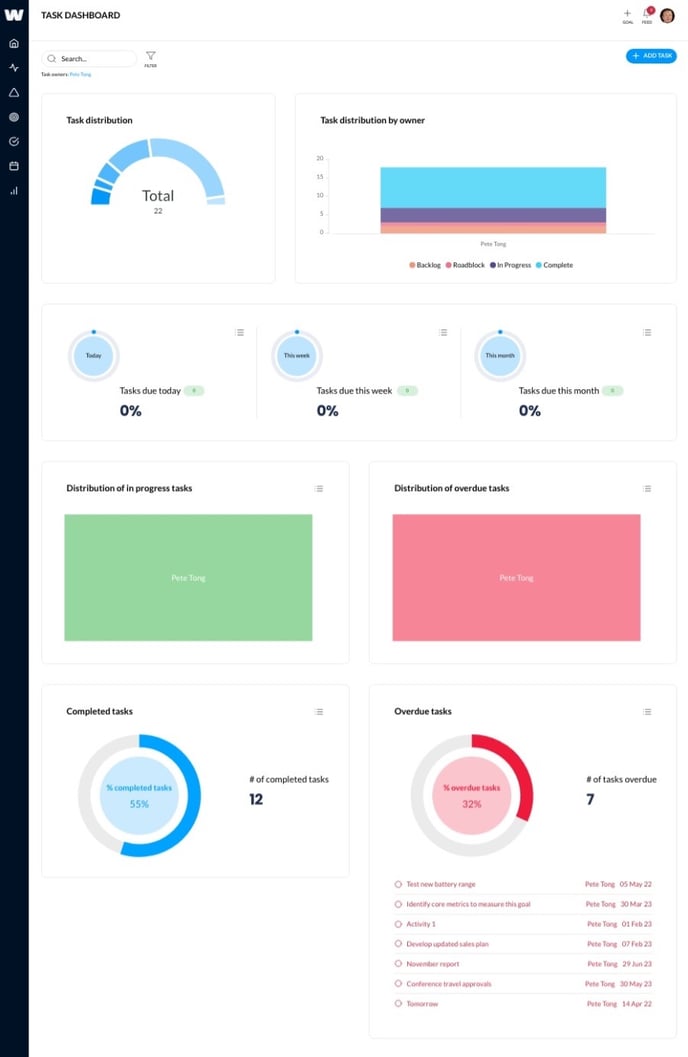
Here is an example of a Task Dashboard run for a specific user.

The task dashboard will provide the following data points.
- Task distribution; what tasks are at what stage.
- Task distribution by owner; if assessing more than one owner of tasks will show a breakdown of stage by owner.
- Tasks due today.
- Tasks due this week.
- Task due this month.
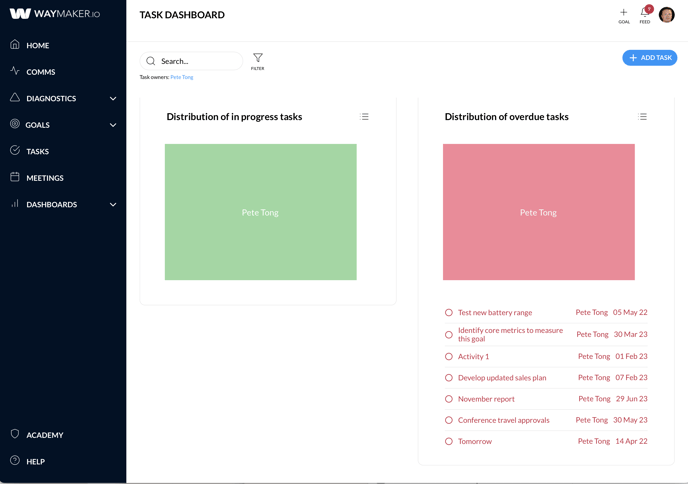
- Distribution of In Progress tasks. Shows which owners of tasks are working on what tasks.
- Distribution of overdue tasks. Shows which owners of tasks have overdue tasks.
- Completed tasks shows the number of all completed tasks.
- Overdue tasks shows the number of all overdue tasks.
Interactive charts
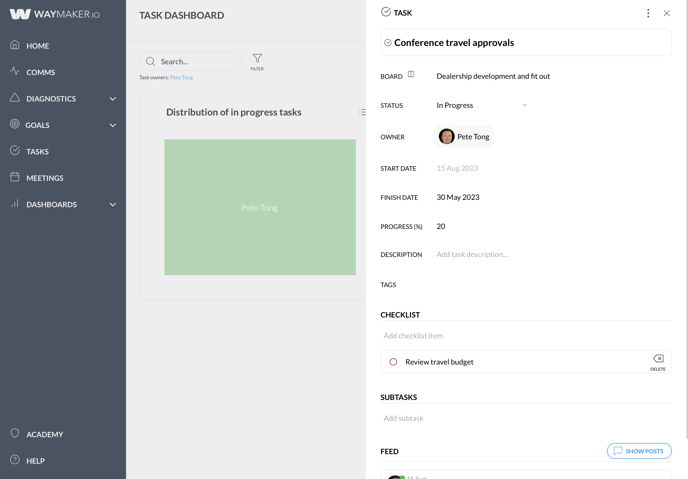
Charts on the task dashboard are interactive, in that clicking on the chart or the menu (three dots/lines) will expand the list of tasks.

Clicking on a task in the list will reveal the task editor.

