
Waypoints are how outcomes are tracked against a forecast on waymaker.io
Learning outcomes:
- What are waypoints
- What are the benefits of waypoints
- How are waypoints created
- Cumulative vs discrete waypoints
- How to access and edit waypoint data
What are waypoints?
Waypoints allow users to track outcome progress against forecast at key intervals during the term of the outcome. They are visible in the outcome editor, and can be updated or edited. At a high level they consist of a date, a forecast value, and a target value.
Waypoints are specific milestones or checkpoints throughout the term of a goal. They are applied to outcomes and allow users to compare forecast progress against actual progress, and make data-driven decisions. Waypoints are used to measure and assess performance and provide insights into the pace and success of achieving outcomes.
By monitoring outcome progress, individuals and teams can stay on track, make informed decisions, and continuously improve performance towards achieving their outcomes. Waypoints also play a vital role in performance management, goal alignment, and fostering a data-driven culture within organisations.
The benefits of waypoints
Tracking outcomes using waypoints in Waymaker.io offers several benefits that contribute to effective goal monitoring and decision-making.
Waypoints enable granular progress monitoring by breaking down outcomes into specific dates with forecast and actual values. This level of detail provides insights into the pace and consistency of progress over time. And by setting forecast values in advance, users can evaluate the accuracy of their predictions against actual outcomes. This analysis helps in refining future forecasts and improving planning capabilities.
With actual values updated on the date of the waypoint, users can make data-driven decisions based on real-time performance. Comparing forecast and actual progress helps identify trends, discrepancies, and areas for improvement. Tracking outcomes through waypoints allows users to identify deviations from the forecast early on. This timely information enables proactive adjustments and corrective actions to keep goals on track.
Overall, tracking outcomes using waypoints in Waymaker.io empowers users with accurate, real-time data, and actionable insights. It promotes goal achievement, collaboration, and a culture of performance improvement within the organisation.
How are waypoints created?
We believe in the rule of twelths. That is, we believe there should be at least 12 check-ins for each goal. In preparation for each check-in, the goal owner should update their goals and outcomes.
So, if a goal's term is quarterly, there should be a weekly check-in. If the goal's term is 1 year, there should be a monthly check-in. While we recommend this approach, we do not enforce it.
When a goal is created twelve check-in dates are added to it. When an outcome is created, we create a waypoint for each of those check-in dates during the term of the outcome.
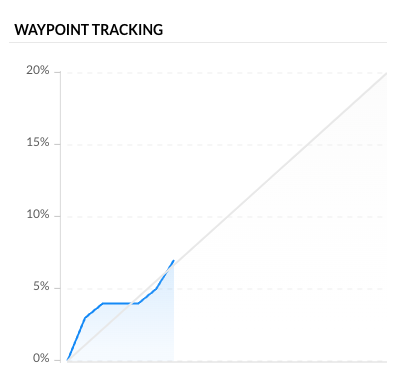
When you first create an outcome, a loading panel appears in the top right section of the outcome editor. This indicates the waypoints are being generated. Once complete, the waypoint tracking chart is displayed. The grey line indicates forecast, and the blue line or bar indicates actual progress.
Cumulative vs discrete waypoints
Cumulative waypoints track a running total such as selling 5200 units in 12 months. Discrete waypoints track a specific value such as complete 25 sales meetings per month.
Cumulative waypoint tracking is displayed in a line chart, whereas discrete waypoint tracking displays forecast as a line and actual as bars on the chart.
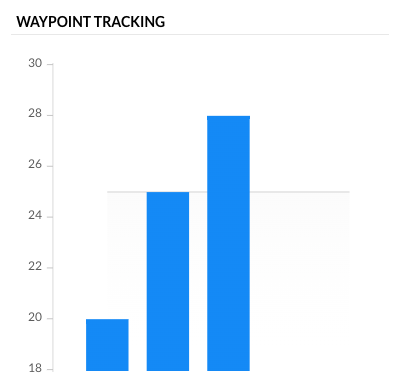
As cumulative tracks a running total, as the progress of the outcome increases, the waypoint tracking reflects this. Discrete waypoints behave slightly differently. On the date of the waypoint, the outcome progress is recorded, and the outcome progress is reset to the starting value.
Using the example of complete 25 sales meetings per month, on the last day of each month, the progress is recorded and visualised via a bar on the chart. The progress is then reset to 0 so the number of meetings completed during the next month can be recorded. This outcome could be measured cumulatively by setting the target as 300 meetings, but this does not provide a snapshot of the number of meetings completed monthly.
Discrete measures are a great way of monitoring kpis, and gaining granular insights into a person's daily, weekly or monthly habits and performance.
How to access and edit waypoints
Waypoints are accessible from the outcome editor. Click the more actions button in the top right then view and access waypoints.
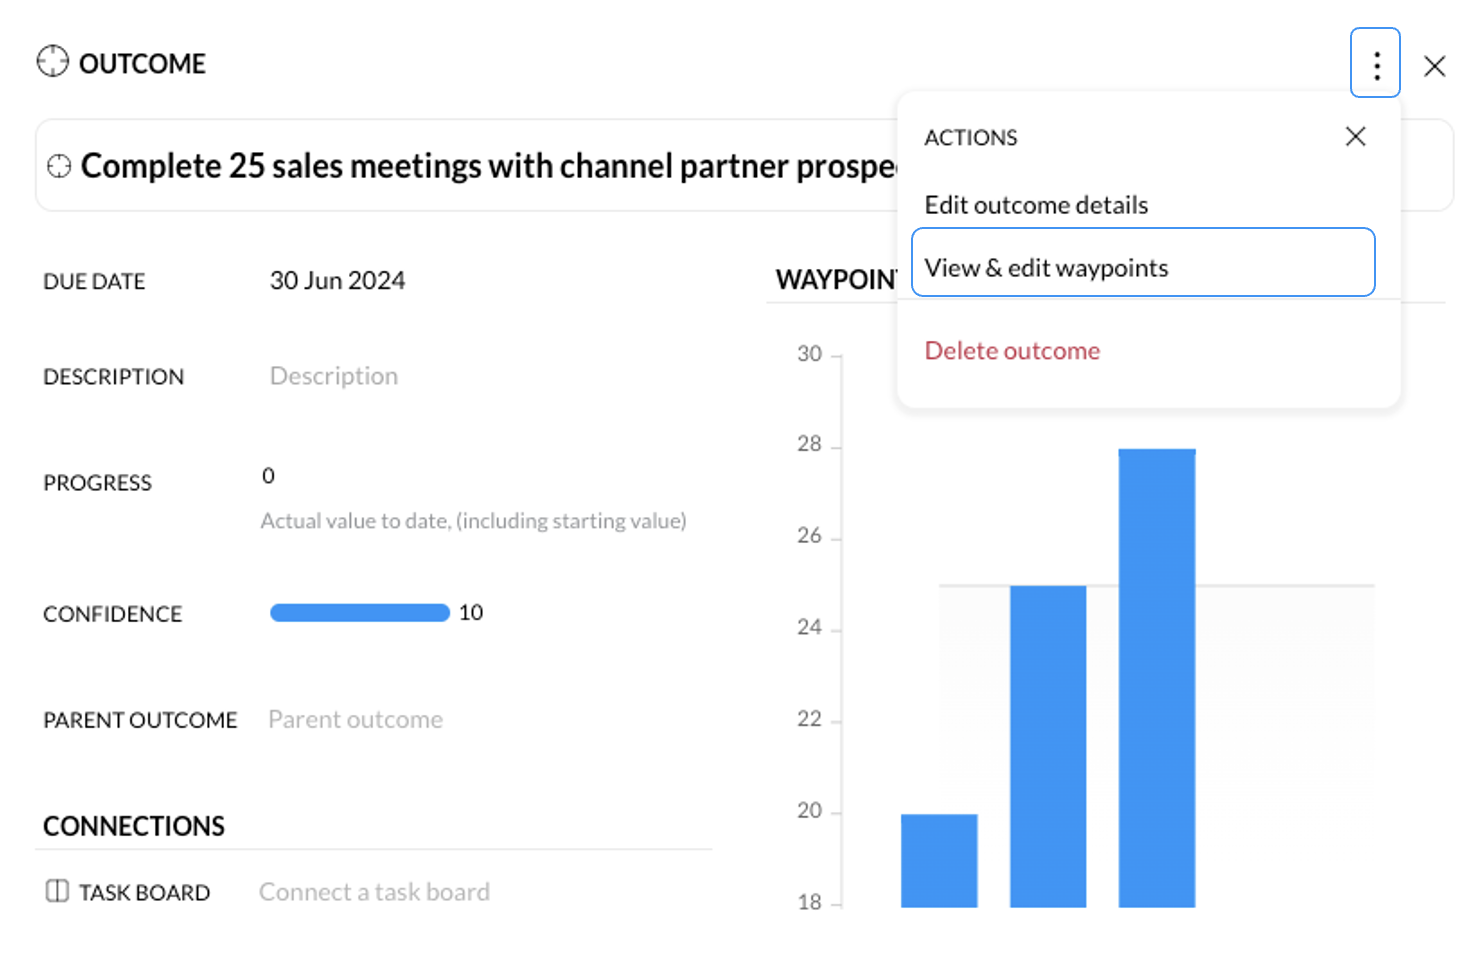
The waypoint tracking chart and data table will be displayed.
%20(3).png?width=688&height=516&name=app.waymaker.io_version-test_goals_1607302858034x911938104401592300(iPad%20Pro)%20(3).png)
Each data point, date, target and actual, are editable. Waypoints can be deleted by clicking the delete button in line with each waypoint, and further waypoints can be added by clicking the add waypoint button beneath the data table.