There are three kinds of dashboards any user can create; Scorecards, Goal Dashboards, Task Dashboards.
There are three kinds of dashboards in Waymaker.
- Scorecards
- Goal dashboards
- Task dashboards.
Scorecards
A scorecard is a performance measurement tool used to track and evaluate the progress of specific outcomes, or key performance indicators (KPIs) over time. It provides a visual representation of the performance data, making it easy to understand and interpret actual vs forecast on outcomes.
Scorecards allow users to organize one or many outcomes, from one or many goals, owned by one or many people.
Scorecards are infinitely flexible, agile, and very easy to create.
Typical use cases of a scorecard would be.
- Tracking revenue across a sales team.
- Tracking the top line strategic KPIs or metrics for a leadership team.
- Tracking financial metrics across the balance sheet and cashflow statements.
- Tracking marketing performance metrics for a team, campaign, or product.
- Tracking the success of a product launch across multiple teams and multiple goals (OKRs).
- Providing a board snapshot on critical health metrics.
- Track critical metrics that relate to a team in a meeting (see how to integrate scorecards into meetings here)
Scorecards can be created in less than a few minutes to do that read this article.
An example Scorecard is below. Note, there is no limit to the outcomes you want to include. However, we recommend 8 - 12 as a guide.

To create a scorecard follow the steps in this article.
Goal dashboards
A goal dashboard is a performance measurement tool to assess performance of goals and the related outcomes within those goals.
Use the goal tracking dashboard to review the performance of an individual, team, or business unit.
Typical use cases of a goal dashboard would be.
- Reviewing the goals for a business plan, sales plan, marketing, plan, or strategic plan.
- Reviewing the goals of an individual for a review.
- Reviewing the goals of team for a retrospective or alignment session.
- Reviewing the goals of a business unit or team for an annual or quarterly retrospective or planning session.
- Identifying outcomes at risk across a group of people to manage risk in execution.
Note, where relevant, dashboard data points can be selected to filter to that item. For example, to see all outcomes at risk, click on outcomes at risk to show all outcomes across all goals in the filter set which are at risk.
Here is an example goal dashboard.

To create a goal dashboard follow the steps in this article.
Task dashboards
Task dashboards are a performance measurement tool used to track and evaluate the delivery of tasks in a simple or project task board.
Task dashboards tell the viewer if tasks are getting done or not.
A task dashboard can be viewed within the specific task board in the task module. This will show the status of tasks only for the task board.
Within the Dashboard module, task dashboards can be run to look at tasks more holistically.
Typical use cases for task dashboards would be.
- Reviewing task performance for a specific task board. Do this in one click on the task board in tasks, or do this via the dashboard centre.
- Reviewing task performance of an individual across multiple task boards and meetings.
- Reviewing task performance over time.
- Reviewing task performance of a team over one or more boards.
- Identifying workloads of team members and understanding overall task weighting and results.
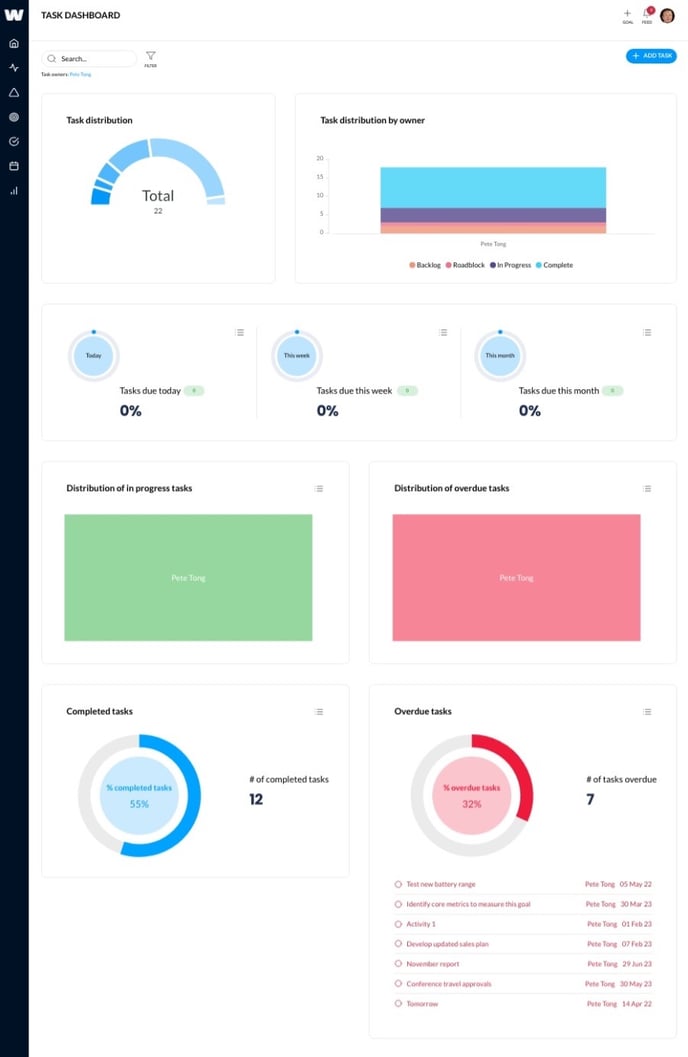
Here is an example of a Task Dashboard run for a specific user.

To create a task dashboard follow the steps in this article.
